Monday, February 20, 2017

Hats off to Hopper!

As I learn more about the history of computing, I'm realizing that many, and maybe most, of the pivotal contributions  have come from women.

For example, Ada Lovelace, is credited with developing the first algorithm during her work on Babbage's Analytical Engine.

Today, I learned a little more about Grace Hopper. (The image is from Wikipedia.) As well as developing COBOL (one of the first languages I remember hearing about), I now realize that Rear Admiral Hopper wrote the first compiler.


I consider myself to be a semi-competent and a fairly experienced scientific programmer and I have a hand-waving knowledge of many aspects of 'computer-stuff'. However, I have not the faintest inkling of how I would go about making a compiler.

Hats off to Hopper!

Thursday, February 9, 2017

MATLAB, St. Andrews, and the evolution of culture

Here are two facts:
  1. I grew up near St Andrews in Scotland
  2. I use MATLAB a lot
Any blog that combines these points must be interesting, so I was excited to learn that biologists at the University of St. Andrews are running a MATLAB programming contest in order to measure how a culture evolves.

Saturday, January 28, 2017

Hidden Figures - a Hollywood film where numerical methods come to the rescue

I've just finished watching "Hidden Figures", a current Hollywood film that focuses on Katherine Johson, Dorothy Vaughan, and Mary Jackson, and their important roles in the early stages of NASA's attempts at manned flight.

SPOILER ALERT BELOW


Hidden Figures has been nominated for 3 Oscars (including Best Picture) and I enjoyed it a lot. It also includes many powerful messages, not least, the important role that African-American females played in 1960's US science.

Our community needs to do more to increase recognition of non-white non-male scientists and mathematicians. A single film can't make up for all of our prior mistakes but, as my PhD advisor used to say,  "at least the progress vector is now pointing in the right direction".

Hidden Figures also includes some gems relating to scientific computing. There can't be many films where the trumpets sound and Euler's method rides over the hill (albeit in small steps) to save the day. I wasn't quite sure but I thought one of the screenshots in that portion of the film was of relevant pages from Numerical Recipes.

I also enjoyed watching Dorothy Vaughan beat the IBM programmers at their own game after she had to taught herself FORTRAN from a library book. It must have been quite a ride.

All in all, a must-see for anyone that likes the history of scientific computing.

It's also a very good film. The audience clapped at the end at our showing, and judging from the pre-film conversations I overheard, I doubt if many were regular readers of this type of blog :-)

Tuesday, January 10, 2017

Souza's law and the difficulty of providing quality technical support

I spent a year of my postdoc writing SLControl, a fairly sophisticated piece of software for acquiring and analyzing data to do with muscle mechanics. It implemented real-time control loops with 100 µs latencies and allowed us to perform completely new types of experiments.

Writing SLControl was a good investment of time; I, or somebody in my lab, has used it almost every day since 2001. However, providing high quality support has been a challenge. The software does complex things and it's normally connected to even more complicated experimental apparatus. Trouble-shooting requires a lot of experience.

Another problem, I discovered is that people sometimes want to use SLControl for things that it wasn't originally intended for. I discovered this early in the development process when somebody called me up to ask how to fit a 3 parameter exponential to their experimental data. Their measurements had nothing to do with muscle mechanics (SLControl's niche) - the data was just some list of numbers from a fairly random experiment. Maybe it was to do with flow in a river or something. The person requesting help had googled "3 parameter exponential", found a match on the SLControl website, and decided to call me for help.

That, in a roundabout way, gets us to Souza's law. Every time you include a text field on a website, somebody will eventually use it to ask for tech support :-)

Read more on the brilliant MathWorks blog.

http://blogs.mathworks.com/community/2017/01/10/tags-tech-support-and-souzas-law/

Friday, October 14, 2016

How to read things without opening them

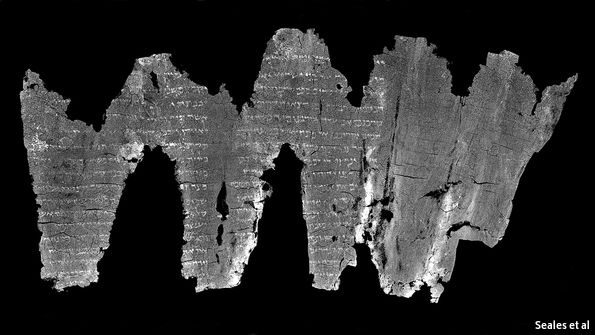
Brent Seales is a professor of computer science at the University of Kentucky. He drives several very cool research programs in areas ranging from robotic surgery to advanced image progressing.

Recently, the Economist (one of my favorite weekly reads) featured some of his work. Here's a link.

How to read an old scroll without opening it


Tuesday, October 11, 2016

iCite and W2P ratios - new ways of quantifying scientific productivity

What's the best way of ranking scientists based on their productivity?

There are lots of options including:
  • number of publications
  • number of citations
  • impact factor of the journals the publications are in
All have strengths and weaknesses.

Recently, leaders at my academic institution have started to talk publicly about h-indices. These are calculated for each author as the number (x) of publications he/she has that have each been cited at least x times. That's an interesting idea because it rewards impact; people who publish lots of papers that nobody cites have lower h-indices than people who publish a few manuscripts that are very influential. However the h-index has the drawback that it grows with time (because people publish more papers and they have more time to be cited). This means that it favors seasoned scientists who have been productive for a long time. It's not a great way of identifying a rising star.

I don't think that there will ever be a single perfect metric that scientists can use to quantify productivity but I was excited to see that NIH is supporting the Relative Citation Ratio with their new iCite tool.

The Relative Citation Ratio (RCR) is an article level metric that quantifies scientific influence. To quote a help box from iCite, "It is calculated as the cites/year of each paper, normalized to the citations per year received by NIH-funded papers in the same field."

The Weighted RCR is the sum of the individual RCRs for a group of papers.

This creates an interesting opportunity. If you calculate the ratio of the Weighted RCR to Total Publications (I'll call it W2P) you get a single value that defines the influence of a collection of papers.

If your W2P is greater than 1, your papers are more influential than those of your NIH-funded colleagues. If it's less than 1, your papers are being cited less often than average.

WtoP doesn't scale with the number of papers you publish so it shouldn't depend on the length of your career.

Only time will tell how scientists use these new metrics but I am going to make a bold (and probably rash) prediction. Since NIH is supporting RCRs, I think that they will take over from h-indices as the mostly commonly used measure of productivity in US biomedical science.

For the record, here are my current stats
  • 46 publications
  • h-index = 22
  • Weighted RCR = 59.98
  • W2P = 1.34
and for the truly nerdy

Monday, September 5, 2016

The Pentium Bug

I remember the Pentium Bug in 1994 (I had just started my PhD) but didn't know enough about scientific computing to understand the significance.

Here's a fascinating blog post from Cleve Moler describing what happened.

Saturday, September 3, 2016

POVRay sarcomeres - final touches

This post tidies up some loose ends about making movies of muscle sarcomeres in POV-Ray. I blogged earlier about

Putting all these techniques together allowed me to render an image of chain of sarcomeres.

The most difficult part here was defining the geometry and making sure that I was drawing each object in the correct x,y,z location. I automated this process using MATLAB. The whole scene is made up of spheres, cylinders, and boxes. A few objects are merged together as blobs.

Once I had that working for a single image, I just moved the camera around the scene until I had a sequence that I thought looked interesting. Then I rendered the images (it took a few hours on my PC) and stitched the sequence together to make a movie.

Here's the final result.


I am happy to share the code but it may take me some time to get it posted online. If you want to get it sooner, just send me a note via a comment below.

Thursday, August 25, 2016

How to learn to code?

Coding (perhaps like most things) is all about perspective.

My academic appointment is the Department of Physiology in the Medical School at the University of Kentucky. Only a few people in the department know how to program and, as a result, most of my colleagues think I'm 'pretty good with computers'.

My collaborators in Engineering and Chemistry across the street are always polite but think I code like a Geico Caveman.

Why do so few physiologists code? I used to think it's because biomedical scientists didn't think it was useful but I've changed my mind. I now think that our students don't code because they've never been taught. They've typically taken lots of courses in biology, chemistry, and genetics, but nobody has shown them how to write code, or how to break a task down into little steps so that they can create an algorithm.

What's the best way of helping these students get started?

I've blogged about how I  learned to program before but my advice won't work for everybody and I'm always looking for new resources that I can tell students about.

Today, I came across the MATLAB OnRamp. This resource has actually been around for several years but I hadn't seen it before and it looks interesting. If you have any experience with it, or can suggest better ways of getting started in scientific computing, please share your thoughts in the comments below. 


Monday, August 22, 2016

Filtering binary images by object size in MATLAB

As usual, I learned something new when I read Steve Eddin's latest blog post.

This time around, I discovered that MATLAB has some new features that make it easy to filter binary objects based on their size. There were, of course, old ways to do this but the new bwareafilt command (at least, new in MATLAB 2014B) simplifies some workflows.


Sunday, August 21, 2016

POV-Ray animation

This post continues my introduction to generating images and movies using POV-Ray.

In the last post, I showed how to render a simple scene. Now I am going to show how to animate it.

POV-Ray includes a lot of options for animation and this page provides some great tutorials and examples. However, I have always found it easier to generate animations by automatically generating different *.pov files and then rendering them as part of my workflow.

The last part is easy because you can call POV-Ray directly from the command line. (See here for many options.)

For example, once you are in the directory that contains the main POV-Ray executable, you can produce a PNG file that is 340 by 280 pixels from the scene described in c:\temp\out.pov using this command.

pvengine +W340 +H280 c:\temp\out.pov /exit

Here's some MATLAB code that will spin the camera around the previous image.

function povray_animation

r = -25;
no_of_points = 50;
x = r*cosd(linspace(0,360,no_of_points))

for i=1:no_of_points
    
    pov_file = fopen(fullfile(cd,sprintf('out%.0f.pov',i)),'w');
    fprintf(pov_file,'#include "colors.inc"\n');
    fprintf(pov_file,'background {color White}\n');
    fprintf(pov_file,'camera {location <%f,25,25>\n',x(i));
    fprintf(pov_file,'\tsky <0,0,1>\n');
    fprintf(pov_file,'\tlook_at <10,0,0>}\n');
    fprintf(pov_file,'light_source {<%f,25,25> color White}\n',x(i));
    fprintf(pov_file, ...
        'cylinder {<0,0,0>,<10,0,0>,1 texture {pigment {color Red}}}\n');
    fprintf(pov_file, ...
        'cylinder {<0,0,0>,<0,10,0>,1 texture {pigment {color Green}}}\n');
    fprintf(pov_file, ...
        'cylinder {<0,0,0>,<0,0,10>,1 texture {pigment {color Blue}}}\n');
    fprintf(pov_file, ...
        'sphere {<10,10,10>,3 texture {pigment {color OrangeRed}}}\n');
    fclose(pov_file);
    
    cd_string = 'cd c:\program files\pov-ray\v3.7\bin';
    command_string = sprintf('%s\npvengine +W340 +H280 %s +A /exit', ...
        cd_string, ...
        fullfile(cd,sprintf('out%.0f.pov',i)));
    batch_file = fopen('pov.bat','w');
    fprintf(batch_file,'%s\n',command_string);
    fclose(batch_file);
    system('pov.bat');
end

It's now easy to stitch the *.png files together to make a movie.


Saturday, August 13, 2016

POV-Ray basics

POV-Ray is a ray-tracing program. My simplistic view of what this means is that POV-Ray can turn a description of a scene into an image.

Here's an example.


1) Install POV-Ray (downloads here)

2) Start POV-Ray, and create a new file

3) Copy and paste the following text into the new file.


#include "colors.inc"

background {color White}
camera {location <-25,25,25>
sky <0,0,1>
look_at <10,0,0>}
light_source { <-25,25,25> color White }
                     
cylinder{<0,0,0>,<10,0,0>,1 texture {pigment {color Red}}}                    
cylinder{<0,0,0>,<0,10,0>,1 texture {pigment {color Green}}}
cylinder{<0,0,0>,<0,0,10>,1 texture {pigment {color Blue}}}

sphere {<10,10,10>,3 texture {pigment {color OrangeRed}}}


4) Run

5) You should see the following image


6) Here's what the *.pov file did

  • It put a camera at x=-25, y=25, z=25.
  • The sky command aligned the camera along the z -axis. (If there was a pole sticking out the top of the camera, the pole would be parallel to the z axis.)
  • The camera is pointing at x=10, y=0, z=0.
  • There is a light at the same location as the camera.
  • Three cylinders start at the origin <0,0,0> and run along the x, y, and z axes respectively.
  • Finally, there's a sphere at x=10, y=10, z=10.

7) When you pressed Run, POV-Ray worked out what the camera would have seen and created a *.png file of the view.

That's the basics. Everything else I've done in POV-Ray is just an extension of these sorts of techniques. I'll describe a few of my tricks in upcoming posts.

If you want to see what experts can do, take a look at the POV-Ray Hall of Fame.

Wednesday, August 10, 2016

Word clouds

A quick aside - I will get back to POV-Ray soon.

I wanted to make a Word Cloud for something at work. I've never done this before so I adopted my usual strategy - look in the MATLAB FileExchange to see if somebody has already created a tool.

As is nearly always the case, I found something useful, WordData Visualization. It was even a Pick of the Week back in 2015.

Five minutes later, and I had what I wanted. Then I went on to generate a figure based on the text from my PhD thesis. It doesn't get much more exciting :-)


Sunday, August 7, 2016

POV-Ray - old but gold

I wanted to render some 3D images recently. I downloaded SketchUp and Blender and did some quick googling.

Both packages look really interesting but they look as if they are primarily GUI-based. I realize that's what most people probably want but I needed to render a scene that contains thousands of objects. I didn't want to have to add these into my scene one at a time.

I'm sure somebody will explain how to create complex scenes in SketchUp and Blender (please write a comment if you do) but I decided to go back to POV-Ray. It's old (the last release was in 2013) but it's very functional. I used MATLAB to create my scene in the POV-Ray format (*.pov) and then rendered the image using the POV-Ray engine.

I'll explain how I automated the process in the next few posts and created 'fly-through movies' with a single click but, for now, here's a quick example of the sort of image I was able to generate.

I think it's pretty cool.


Tuesday, June 7, 2016

Machine learning and your car insurance

Here's another super-interesting post from the blogs on MATLABCentral.org.

http://blogs.mathworks.com/headlines/2016/06/07/your-car-doesnt-have-to-be-smart-to-be-a-privacy-concern/

A group at the University of California San Diego has analyzed data collected from standard sensors that are already embedded (and active!) in modern cars. Machine learning detected 'signatures' in the driving patterns of the participants and these could be used to identify the driver with near 100% certainty in a separate series of tests.

It will be interesting to see how this technology develops. Will insurance companies start to use these techniques to determine if it was you, or your teenage child, that backed into the garage door? Will society decide that this is an invasion of privacy.

I don't know, but then again, I bike to work :-)

Ken

Monday, May 23, 2016

Numerical integration

I love reading everything Cleve Moler writes about scientific computing. He makes things sound so simple and I always learn something new. In fact, I nearly always learn lots of things.

Here's his latest blog post on numerical integration.

http://blogs.mathworks.com/cleve/2016/05/23/modernization-of-numerical-integration-from-quad-to-integral/

Wednesday, May 18, 2016

Update on WTFIT

A few weeks ago I blogged about an amazing new bot that was developed by the incomparable Ming Cheuk.

Since then, I've been wondering exactly how it works. Ming's interesting post on Medium provides some answers.

Finally, just for the record, and to keep things in perspective, I should point that WTFIT doesn't always work exactly like you'd hope.

Here's a picture I tested it with. The main character in the image is Ming.


Monday, May 9, 2016

New resources for learning about differential equations

Students often ask me how they can start to learn about scientific computing.

I normally tell them to do what I did - start with a problem that they are interested in (maybe one that they are working on?) and begin to tinker. Here's how that worked out ...


But I realize that there are probably better approaches. For example, many people now like to learn by watching videos and tutorials.

This blog post caught my eye this morning and the videos, lectures, and online material look super interesting. I hope to give these courses a try myself.

http://blogs.mathworks.com/cleve/2016/05/09/strang-and-moler-video-course-on-differential-equations/

Friday, May 6, 2016

Image recognition and a new bot

Ming Cheuk, an exceptionally talented PhD student at the University of Auckland, has created a bot to identify objects in pictures. He calls it WTFIT.

I thought I'd give it a try. You just log in with Facebook and send it a picture. Here's what I got.


Amazing. Try it yourself at http://www.wtfitbot.com/


Thursday, May 5, 2016

Jason and the IT Crowd

I came across this on Facebook today and thought it was very funny.


If you haven't come across Maurice Moss before, he was one of the lead characters on The IT Crowd, a tremendously funny British sitcom.

Incidentally, I wrote about JSON in one of my first blog posts.